

Almost everything on Overview follows the channel you have selected at the top of the page. Switch channel and the numbers change with it; the exception is Upcoming appointments, which is workspace-wide and does not change with the channel. See Navigating DMLY.
Start your day here
The top of the page greets you by name and names your business, then gives you a row of shortcuts to the things you open most: Open inbox, Appointments, Send broadcast, Contacts, Invoices and Get booking link, which opens your booking link ready to share.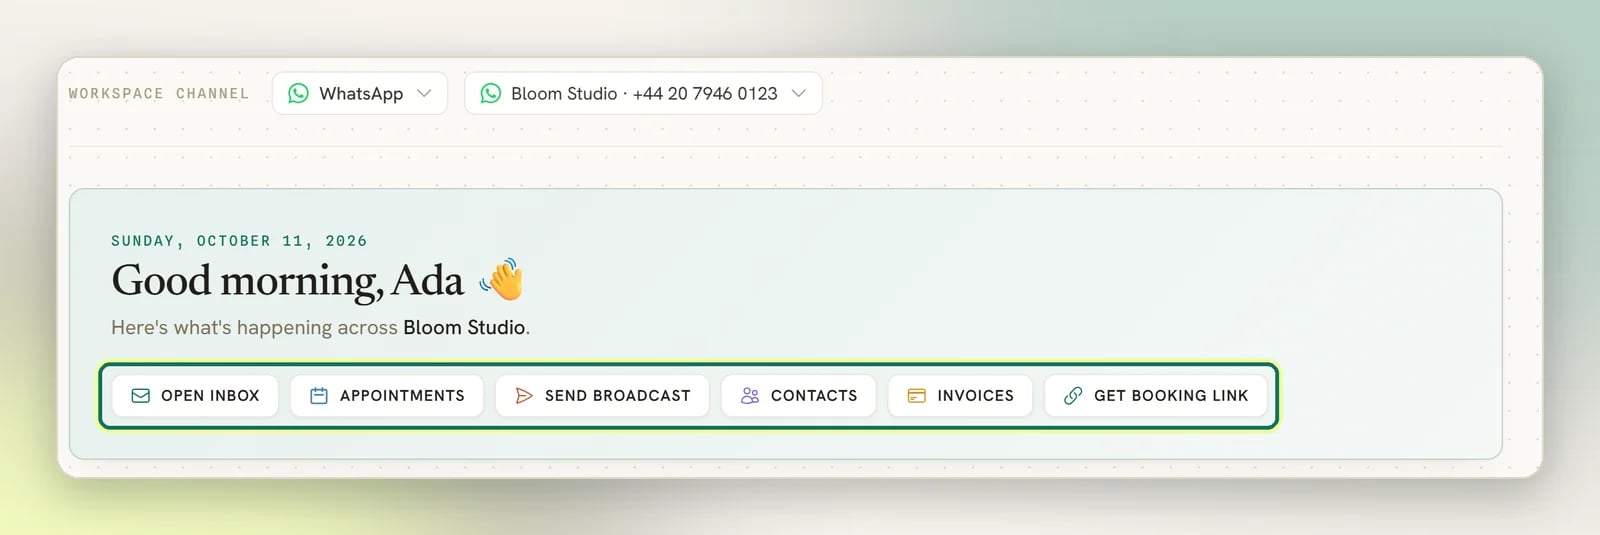
At a glance
The At a glance cards are your headline numbers. Every card except the two call cards is always shown.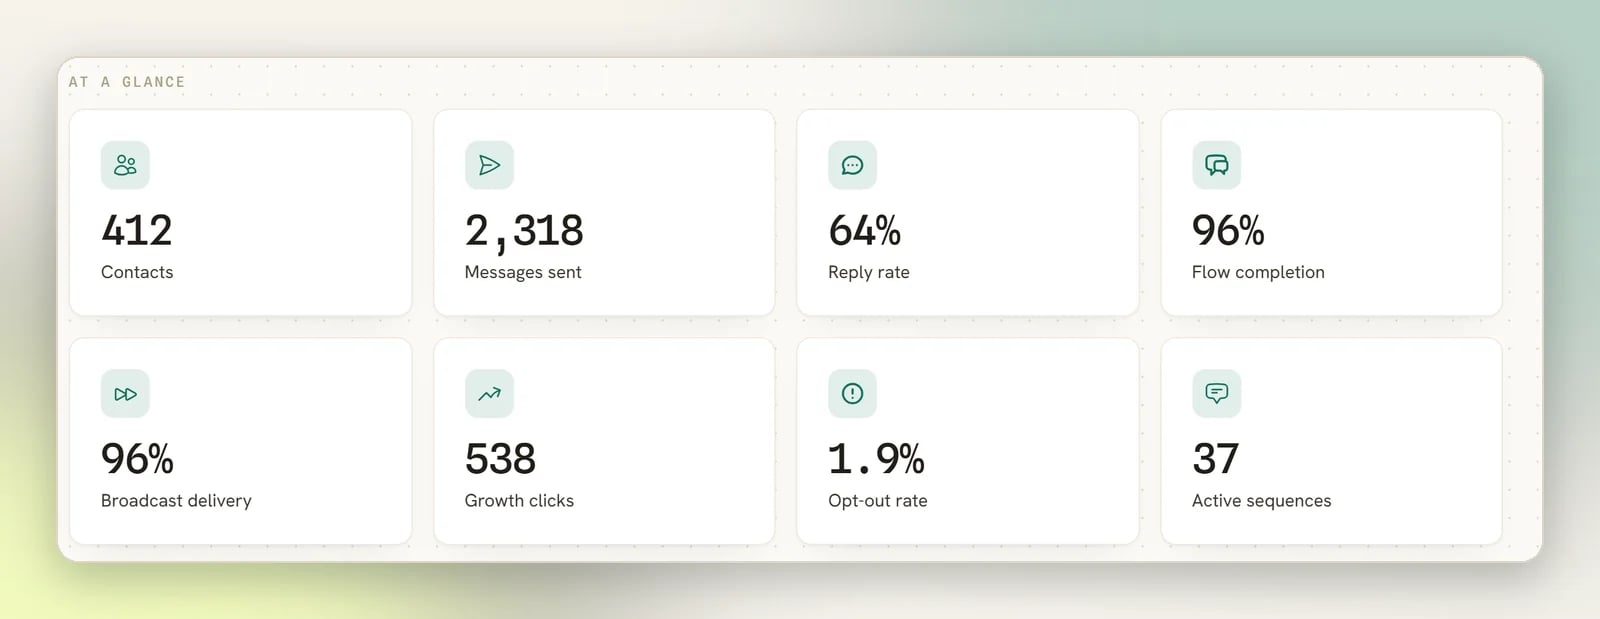
Two more cards, Calls and Call answer rate, appear when your selected channel is a WhatsApp number that has calling switched on or has had calls. With calling on and no calls yet, they read 0 and 0%.
These cards are all-time totals for the selected channel. There is no date range or period picker on Overview, and no comparison against a previous period.
The panels
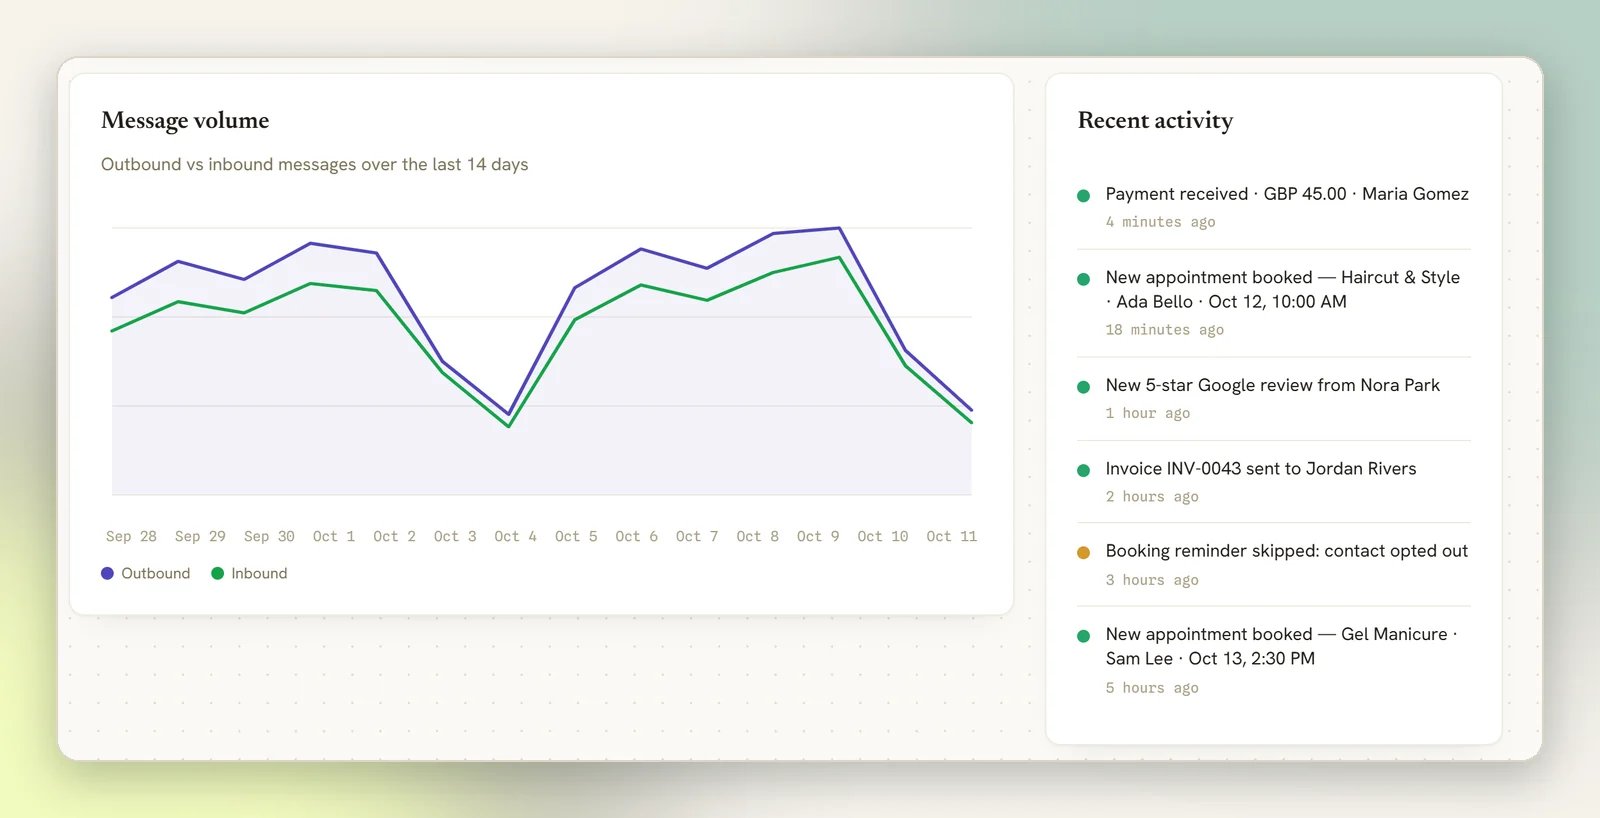
Message volume
Outbound versus inbound messages over the last 14 days, as two lines. Fixed at 14 days. Reads No message activity yet. until messages start moving.
Recent activity
The six most recent events on the selected channel (including workspace-wide business activity such as invoices, appointments, payments, reviews and automation failures), each with a status colour and how long ago it happened. For the full history see Logs.
Peak conversation hours
A heatmap of inbound messages by weekday and hour, over the last 28 days. Darker cells mean more messages arrived at that hour. The chart notes which timezone the hours are shown in.
Growth-tool attribution
Your top six growth tools by clicks, each with the contacts it brought in and a click-to-contact conversion rate, so you can tell a link that gets clicked but doesn’t start a conversation from one that works.
Upcoming appointments
Your next bookings (service, contact, time and staff member) with View all through to Appointments.
Flow outcomes
Where your automation runs end up: Completed, Running, Waiting, Failed, Cancelled. A climbing Failed count is your cue to open Automation not triggering.
Broadcast funnel
Recipients → sent → delivered → opened → replies, each step as a count and as a percentage of recipients, so you can see where a campaign drops off.
Contact sources
Your six biggest contact sources by count: where people are actually coming from. Somebody who tapped a Click-to-WhatsApp ad arrives here named after the ad, as
WhatsApp ad: Summer Sale. Reads No contact source data yet. until contacts carry a source.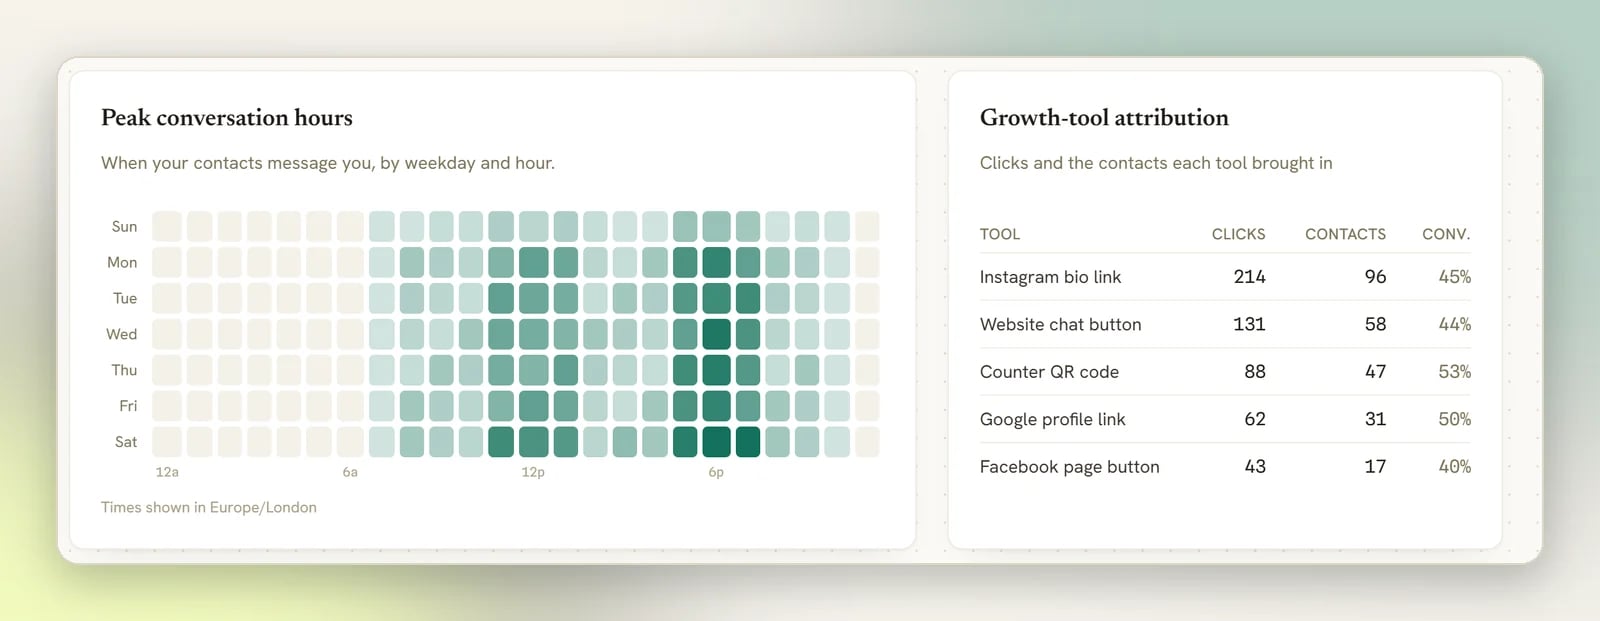
What Overview does not do
There is no date filter
There is no date filter
The only filter is the channel selector. Message volume is fixed to the last 14 days, Peak conversation hours to the last 28 days, and every other number is all-time. The 14-day and 28-day windows don’t line up with each other, so don’t expect the two charts to visually agree on how busy a given day was.
There are no money figures
There are no money figures
No At a glance card totals what you took, what you billed or what you are owed. Recent activity lists invoices and payments as events, not as amounts. For the money itself, open Configurations → Reports and select the Finance tab. See Finance report.
Per-automation numbers live on the automation
Per-automation numbers live on the automation
For one automation’s own performance (runs, completion rate, messages sent, last run and its recent activity), open the automation and use Analytics. See Automation.
Reporting is not plan-gated
Reporting is not plan-gated
Overview is not restricted by plan. What you see is set by your role only. If a panel or shortcut is missing, check Roles and permissions.
What to check next
Conversation reports
How to read inbound versus outbound volume and reply rate.
CSAT report
Response rate, average score and satisfaction, across every survey you’ve sent.
Team performance
Assignments, replies and response times, per teammate.
Finance report
Money in, billed, outstanding and spent, on the Finance tab of Reports.
Ads report
What each Click-to-WhatsApp ad returned: conversations, contacts and revenue.
Reading the Logs page
The full activity feed behind Overview’s Recent activity panel.