

Overview carries no per-agent breakdown, but DMLY does: the Team tab of Reports is exactly
that, teammate by teammate. See Team performance. For numbers
about a single automation, open the ⋮ menu on its row in the Automation list and select
Analytics. See Automation overview.What no screen gives you is a per-conversation report: nothing lists conversations with their
own numbers. The closest thing is Logs, the last Reports tab, and
that is an event feed rather than a report.
What is measured
1
Message volume
A two-line chart headed Message volume, described as Outbound vs inbound messages over
the last 14 days. One line is Outbound, the other Inbound. If neither side has any activity
in the window, the panel shows No message activity yet.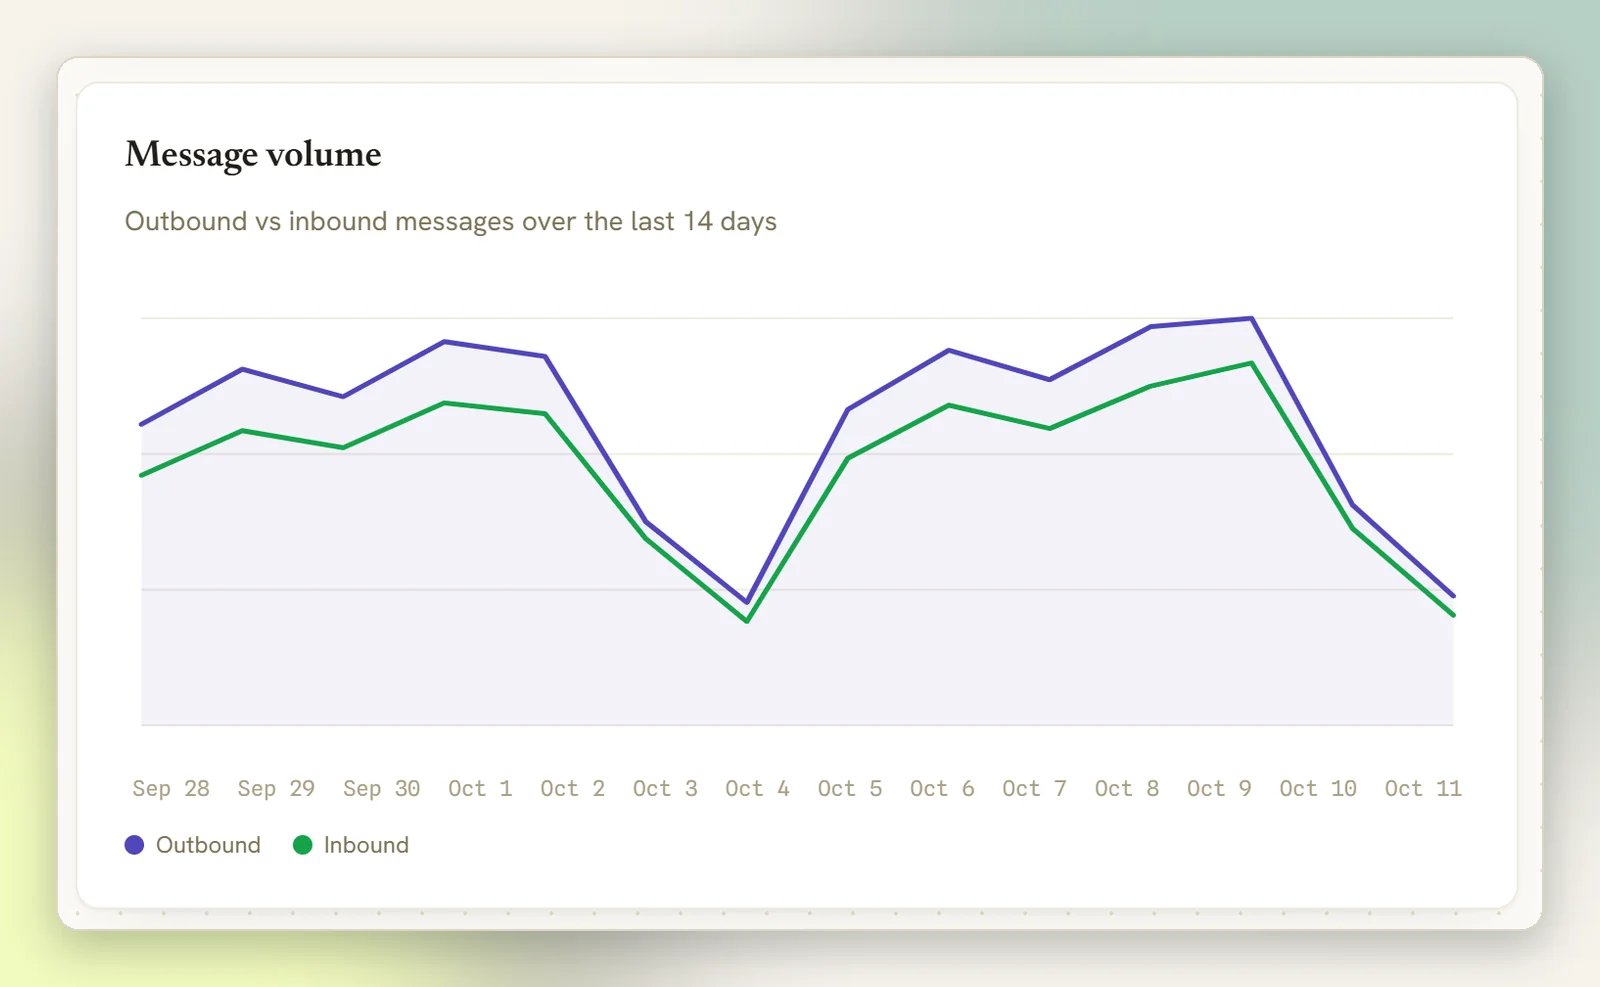
2
Reply rate
A card in the At a glance grid. It is the share of your contacts who have ever sent you
an inbound message, out of all your contacts.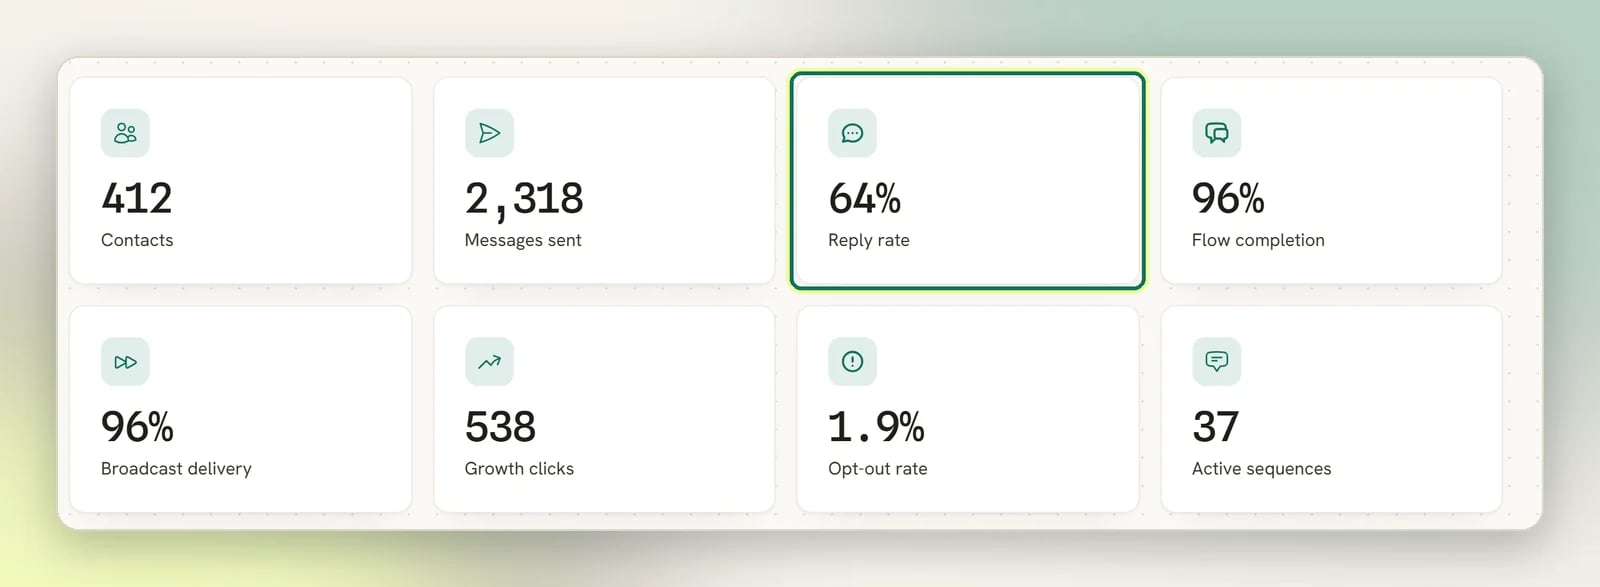
3
Messages sent
A card in the same grid: an all-time count of messages sent for the selected channel.
4
Calls and Call answer rate
Two extra cards that appear only when the selected channel is WhatsApp and that channel has
call history or has calling switched on. Otherwise they are hidden rather than showing zeros.
A number with calling on but no calls yet does show them, reading 0 and 0%. See
WhatsApp.
Filters and date ranges on Overview
This is the part people most often get wrong, so read it before you draw conclusions.- The only filter is the channel selector. Pick a channel at the top of the page and the conversation numbers follow it. There is nothing else to narrow by: no agent, no tag, no segment.
- There is no date-range picker. You cannot change the period, and you cannot compare two periods.
- The chart window is fixed at the last 14 days. It is not adjustable.
- Every other number is all-time. Reply rate, Messages sent and the rest count everything since the workspace started, not the last 14 days.
How to read them
Message volume is per channel
Message volume is per channel
Switch channels and the chart redraws. If you run WhatsApp and Instagram, neither view shows a
combined total; check each one. A completely flat chart on a channel you know is busy is a
connection symptom, not a reporting one; see
No inbound messages.
Recent activity is a live feed, not a report
Recent activity is a live feed, not a report
The Recent activity panel lists the last handful of events on the selected channel with a
status dot and a time. It is there for a quick “did that just work?” check. For anything you
need to investigate properly, use Logs.
What Overview will not give you
- No CSAT scores on Overview. No card here counts survey ratings. They are totalled and charted on the CSAT tab of Reports instead: response rate, average score, satisfaction, a score distribution, a daily trend and the most recent responses. See CSAT.
- No money on Overview. No At a glance card totals what you took, what you billed or what you are owed. Those live on the Finance tab of Reports. See Finance report.
- No ad numbers on Overview. Nothing here tells you which Click-to-WhatsApp ad a conversation came from. The Ads tab of Reports does, ad by ad. See Ads report.
- No export. Overview has no export button. Every Reports tab has export buttons, and so do Contacts and your product catalogue. See Exporting reports.
- No scheduled or emailed reports. Nothing arrives on a timer; every export is one you ask for.
Analytics overview
Every card on the Overview page and what it counts.
CSAT
Collect ratings in a flow, route by score, and read the CSAT report.
Team performance
The per-agent breakdown: assignments, replies and response times.
Finance report
Money in, billed, outstanding and spent, on the Finance tab of Reports.
Ads report
What each Click-to-WhatsApp ad returned: conversations, contacts and revenue.
Exporting reports
What can leave DMLY as a CSV, and what cannot.
Inbox overview
Where the conversations these numbers describe actually happen.