

This is not the same thing as the workspace audit log under Settings → Audit log. The
audit log is a permanent, append-only record of who changed what for a set of high-value
account actions (deleting a contact, changing a role). Logs here is a shorter-lived
activity feed of what the system tried to do: sends, bot runs, integrations, and the business
events above. See Read the workspace audit log if that’s what you’re
after.
What the page gives you
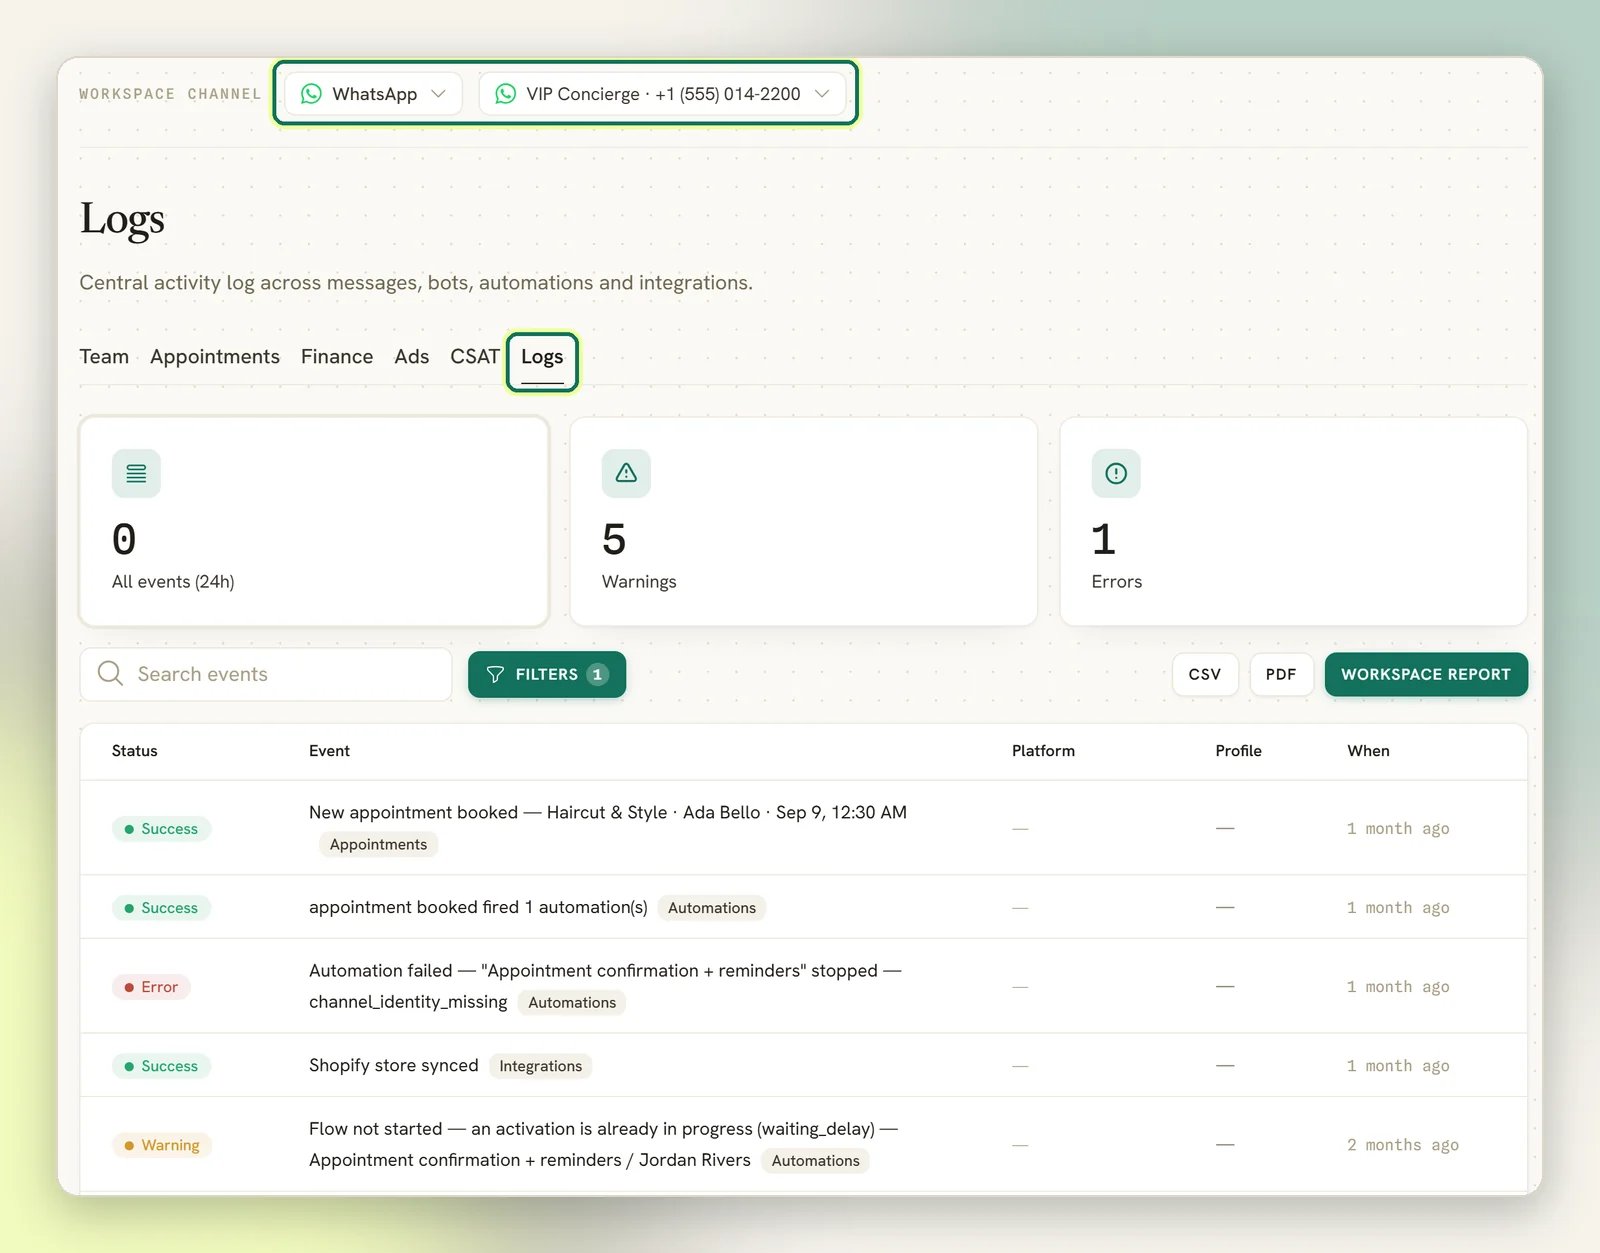
Three counters across the top. All events (24h), Warnings and Errors: they are buttons, not just numbers. Select Warnings or Errors to filter the list to that status, and select it again to clear it. All events (24h) clears the status filter and gives you the whole list back; the 24-hour bound applies to its number, not to what the list shows you. Only that number is time-bounded. Warnings and Errors count everything currently kept in this view (the selected channel plus workspace-wide business activity), not just the last day; see Retention for how far back that goes. A big number there is not a signal that something is wrong right now; the Date range filter is what tells you that. A table of five columns: Status, Event, Platform, Profile and When. The Event cell also carries a small chip naming the category the entry belongs to. Status is one of three things:
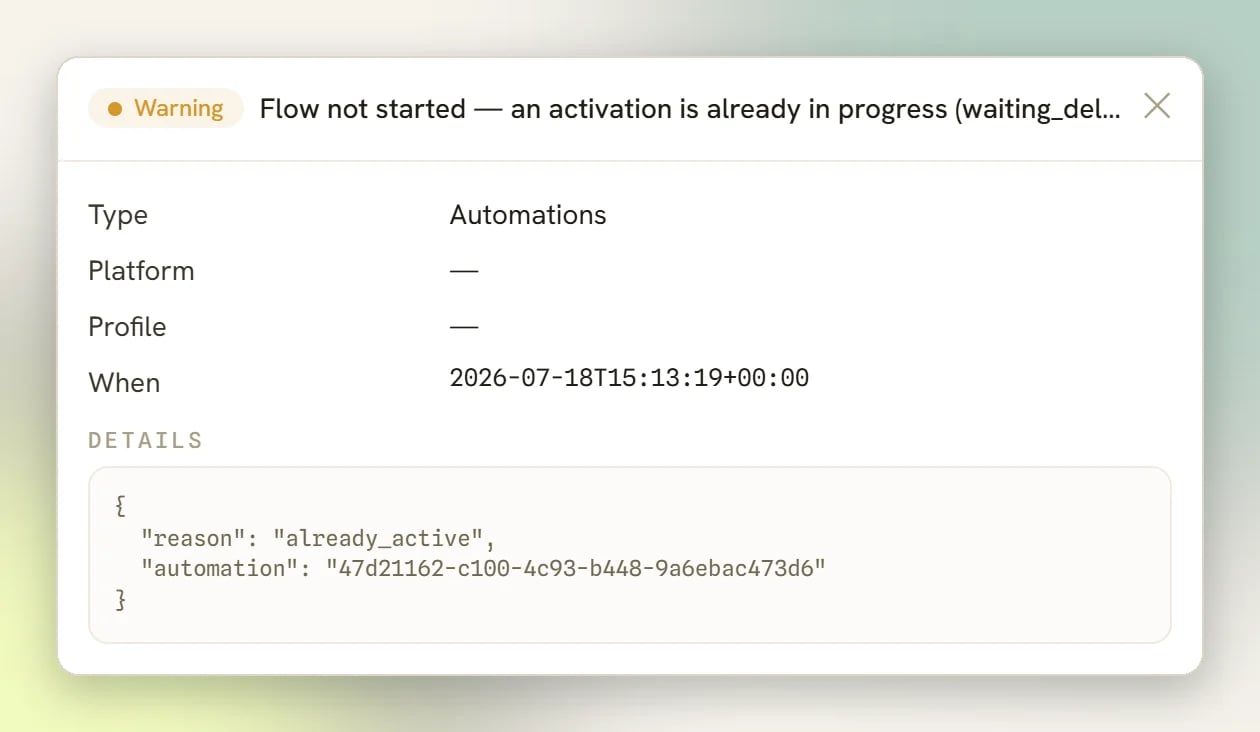
Select any row to open its detail. You get the error in full at the top if there was one,
then the Type, Platform, Profile and When, then the complete technical details
the entry was recorded with. The details are raw: you’re not expected to understand every field,
but they are what you paste to support.
Filtering
Select Filters to open the filter row.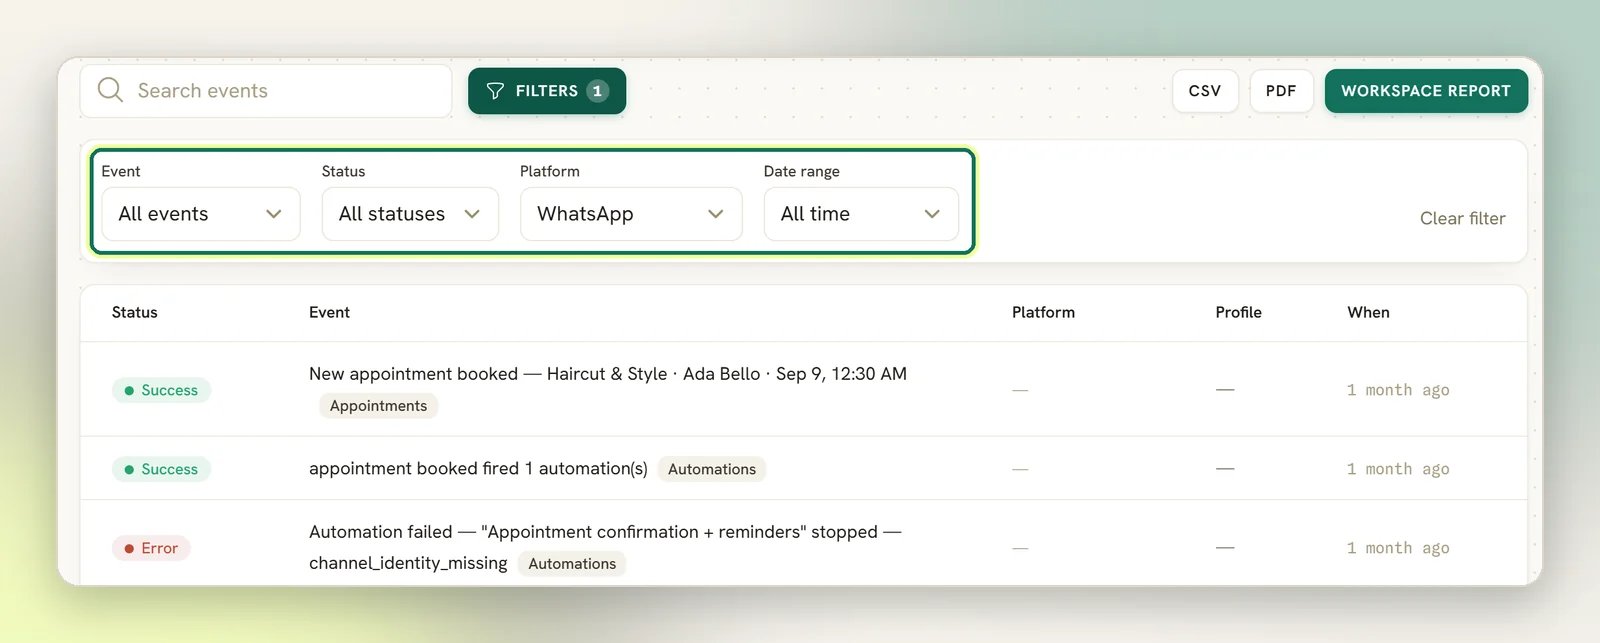
- Search events: a keyword search. It searches the Event text only, not the details inside a row. Searching for an error message you saw in the detail panel won’t find anything; search for the thing the event is about instead.
- Event: the category, despite the name. Messages, Broadcasts, Bots, Automations, Webhooks, Integrations, Delivery, System, Errors, Finance, Appointments and Reputation.
- Status: Success, Warning, Error.
- Platform and Date range: All time, Last 24 hours, Last 7 days, Last 30 days.
Two of the Event options (Broadcasts and Delivery) never return anything. Nothing
in DMLY writes entries in those categories, so choosing them always shows No log entries
match your filters. That is the filter, not a sign that broadcasts or delivery are broken.
For broadcast results, use Broadcasts itself.System holds three kinds of entry. The first is a daily WhatsApp access-token warning. In
the week before a token lapses you get a Warning row reading
WhatsApp connection "…" expires …, and once it has lapsed an Error row reading
WhatsApp connection "…" needs reconnecting. Both name the connection and when its token
expires or expired, and both tell you to reconnect the number. One row per connection per day,
never a duplicate. See Connect WhatsApp. The second is a contact-limit
Warning: Contact added over the contact limit (<source>) when someone who messaged you is
let in over your plan’s cap, or Contact not added — contact limit reached (<source>) when a
store sync is refused. The third is a record of Shopify privacy (compliance) requests. An empty
System list is the healthy state.Exporting
Every applied filter, including the date range and search keyword, carries into the export.1
CSV
Every matching log row for the selected channel: When, Status, Type, Event,
Platform, Profile. Capped at the most recent 5,000 rows.
2
A formatted activity-log report for the selected channel: four counters (Total events,
Last 24h, Warnings and Errors), a breakdown by status and by category, and a
table of the matching rows. That table stops at the most recent 120 rows, far short of the
CSV’s 5,000, and prints Showing the most recent 120 events. underneath when there were
more. The counters and the breakdowns cover every row in the PDF’s own scope, so they stay
right when the table is cut short. They count only the selected channel’s rows, so the PDF’s
Warnings and Errors can come out lower than the same two counters at the top of the
page, which also count the workspace-level entries. Use the CSV when you need the rows
themselves.
3
Workspace report
One PDF of some of the other Reports tabs, sharing a single date window: CSAT, Team
performance and Appointments, plus a Finance section when your
role can view Finance, and an Ads section, on its own page, whenever
the workspace has ad-referred conversations in the 30 days the document covers. Those last
two are gated differently: Finance on your permissions, Ads on whether there is anything to
report. Logs is never in it, so use this tab’s own CSV or PDF for the log itself. It also
ignores the filters set here and always covers the trailing 30 days. See
Exporting reports.
Exporting needs the separate Export reports permission, on top of whatever lets you view
Reports in the first place. See Roles and permissions.
Symptom → what to look for
This is the fastest way to use the page. Find your symptom, apply the filter, read the row.A row reading
send_failed or starting with Failed is the single most useful kind of row
on this page. Both are written when a send fails permanently (an expired token, a missing
permission, a number that can’t be messaged) and carry the raw reason from Meta or the
channel. That’s what turns “the bot is broken” into a specific thing you can fix. See
messages not sending and
automation not triggering for the fixes
themselves.The blind spots
Most of what used to be invisible here now shows up. Webhook deliveries to your own systems (both successes and failures; see webhooks), manual webhook tests (including who on your team fired one), and store syncs aren’t tied to a channel, so they appear under Webhooks and Integrations regardless of which channel you have selected; you don’t need to hunt across channels to find them any more. An inbound message that crashes while being processed is visible too. Once its retries run out, it writes an Error row under the Errors category, such asInbound WhatsApp processing failed, with the error in its details. Set Event to Errors to find it. Only a
crash that succeeds on a retry leaves no row.
A few more limits worth knowing:
- Incoming Live Chat messages are logged like any other channel’s. Each one writes a
Success row reading
Inbound Live Chat message from …, so silence under Messages + Success on a Live Chat widget does mean nothing is arriving. Open a row and its details carry the message text, or[media]and the file name when the visitor sent an attachment, since that has no text of its own. - Sandbox and test sends are excluded from failure logging by design, so a demo number produces a quieter log than a live one.
- If you reload a filtered page or open a filtered link, the filter boxes render empty even though the list is still filtered. The results are right; the controls just don’t show what they’re set to. Select Filters and set them again if you need to be sure what you’re looking at. Platform is the exception: it always shows your selected channel’s platform, whether or not you set it.
Retention
Log entries are not kept forever, and the window is short: DMLY keeps the newest 300 entries per workspace and trims everything older once a day. That keeps the feed a recent-activity view rather than an ever-growing table. There’s no delete button (you can’t remove one yourself), but you also don’t need to worry about the list growing without bound. The trim is count-based, not date-based: a quiet workspace keeps its whole history, while a busy one only keeps its most recent activity, however far back that reaches. Be clear-eyed about what 300 buys you: inbound messages, Inbox replies, failed sends, bot runs, invoices, appointments and reviews all write rows into the same 300, so a busy workspace can produce that many inside a single day. When the next daily trim runs, yesterday is gone. So Warnings and Errors are not true lifetime counts (they’re counts of what’s currently kept), and this is another reason Date range does the real work whenever you use this page. If you need a permanent record of something here, export it (see Exporting) the day you see it, not next week. The practical consequence: never judge health by the size of a number here. Judge it by what turns up under Last 24 hours.Next
Messages not sending
The fixes behind a
send_failed row.Automation not triggering
Why a bot stayed silent, and what to change.
CSAT report
Another Reports tab: response rate, average score and satisfaction.
Team performance
Another Reports tab: assignments, replies and response times per teammate.
Exporting reports
Every CSV and PDF export across Reports, in one place.
Known issues
Things that behave differently from how they look.
Channels
Reconnect or re-authorise the channel a row is complaining about.